I’ve been converting the main posts view in Pinpoint from a table view to a collection view. Unfortunately, I found that it was stuttering even on my brand-new, ridiculously fast iPhone 6s Plus.
The cells have background images, buttons, and gradients, so I thought I’d need to optimize those. But when I spun up Instruments and had a look at the CPU usage I found that a lot of main thread CPU time was spent on layout.
Problem
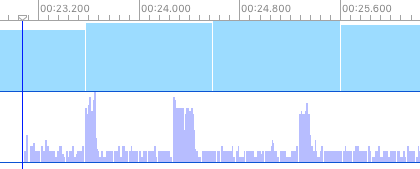
When slowly scrolling through the collection view, I could see spikes like this when each row displayed. Something was taking too much time to prepare those collection view cells. Probably my collectionView:cellForItemAtIndexPath:, right?
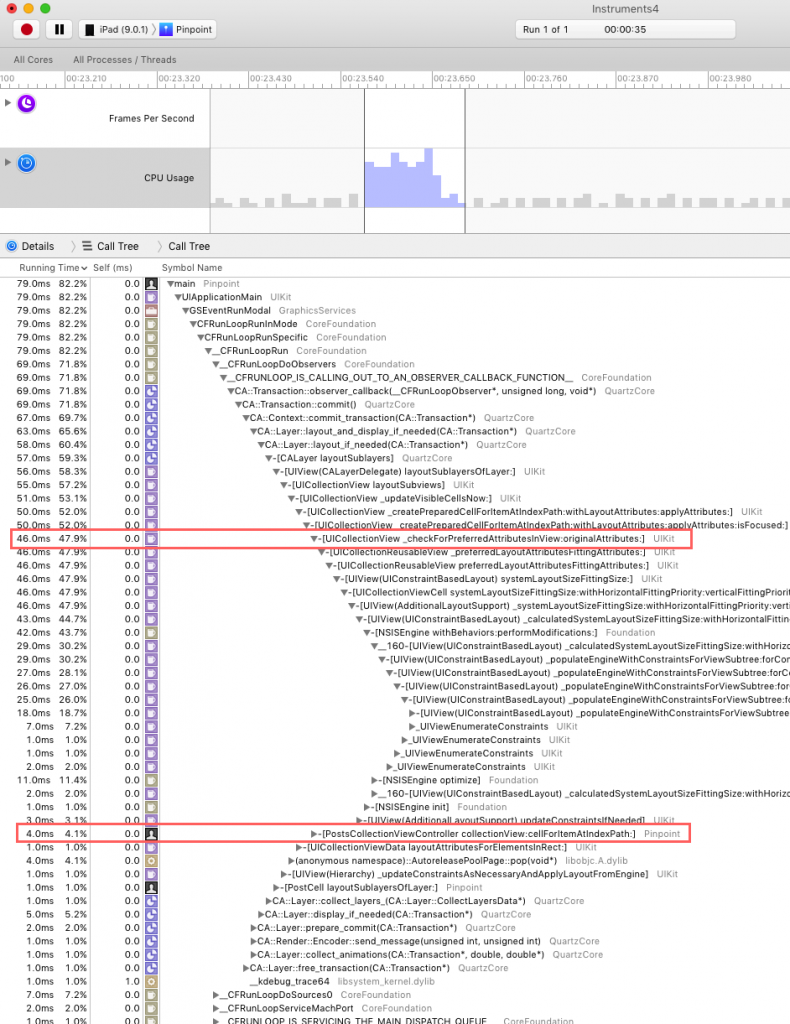
Focusing in on one of those spikes, I could see that the cell re-use looked okay at only 4.1% of the CPU time. But what about that deep stack of Auto Layout calls? Something called -[UICollectionView _checkForPreferredAttributesInView:originalAttributes:] was taking up a lot of CPU time.
Solution
After a bit of searching, I stumbed across a blog post by Marcin Pędzimąż about UICollectionViewCell performance.
Marcin’s suggestion/solution was to use the following in your UICollectionViewCell subclass. Unfortunately he doesn’t say why.
- (UICollectionViewLayoutAttributes *)preferredLayoutAttributesFittingAttributes:(UICollectionViewLayoutAttributes *)layoutAttributes {
    return layoutAttributes;
 }
This completely solved my problem. Scrolling is now super smooth even on a 4S.
I still haven’t found any documentation on why the default implementation is so expensive, but someone else also found that this solved their problem.
I doubt this is a silver bullet for collection view performance, but worth a shot if you get stuck.